Nitrous Engine Combustion Data
The following graphs display data collected from a competitive 700 + cubic inch nitrous engine during competition at a national event.
The data below represents only a small sample of the various data graphs produced after each run down the dragstrip. The software generates graphs summarizing the overall run in terms of HP, torque, combustion pressure, location of peak combustion pressure relative to TDC, volumetric efficiency etc. The software also generates graphs for each and every combustion and non combustion cycle during the run, displaying pressure vs. crank angle, air/fuel burn rates vs. crank angle and numerical data such as HP for each combustion cycle, peak combustion pressure/location, amount of energy released and how efficiently it was applied, etc.

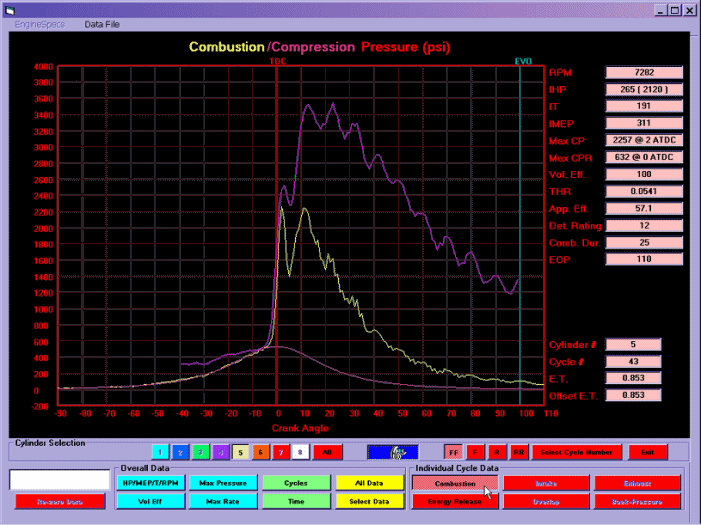
Nitrous Engine Combustion Pressure
(Combustion Cycle 43 - 0.853 seconds into the run)
In the graph above the pink line shows the pressure that would have existed in cylinder 5 if the spark had not ignited the AFN mixture. The yellow line shows the actual pressure in cylinder 5 which was developed as a result of the AFN mixture combustion. The purple line indicates combustion temperature in Celcius.
Peak combustion pressure is 2257 psi at 2 ATDC for this combustion cycle (0.853 seconds into the run). Detonation is severe around TDC (detonation rating of 12) as indicated by the severe spike in combustion pressure at TDC. Power is 265 HP and torque is 191 ft.lb at 7282 rpm for cylinder 5 on this combustion cycle. If all cylinders had exactly the same combustion process (which they do not as displayed later on) the overall power would be 2120 HP at 7282 rpm on this combustion cycle. This cylinder is under severe stress at this point in time while generating average or slightly below average power.

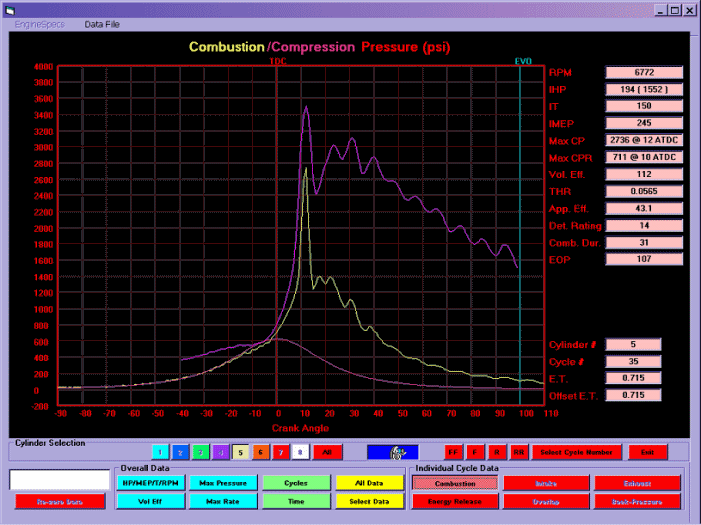
Nitrous Engine Combustion Pressure
(Combustion Cycle 35 - 0.715 seconds into the run)
The combustion process in cylinder 5 is substantially different from the previous graph. Adjustments were made to the nitrous system for this run resulting in a much later combustion process yet still severe detonation occurs around 10-12 ATDCs. Peak combustion pressure is 2736 psi at 12 ATDC and the detonation rating has increased to 14. Torque is down to 150 ft.lb. for cylinder 5 on this combustion cycle. At this point in time cylinder 5 is under severe stress and making well below average power.
Nitrous Engine Combustion Pressure
(Combustion Cycle 12 - 0.275 seconds into the run)
Further adjustments were made to the engine for this run which generated a huge increase in power and torque for cylinder 5 with minimal detonation (2279 psi at 12 ATDC - detonation rating of 7). Torque for cylinder 5 was increased to 252 ft.lb. translating into 2016 HP at a mere 5402 rpm if all cylinders had equal combustion. Due to the effects of increasing heat with time as the run progresses this level of combustion efficiency was not maintained throughout the run, but does indicate just how much potential there is for power without severe detonation when the variables are adjusted correctly. Further appropriate adjustment of engine variables during the run would be required to produce this level of combustion efficiency throughout the run.
Nitrous Engine Combustion Pressure
Comparison of 2 Instrumented Cylinders
In this graph combustion pressures are compared for cylinders 5 (yellow line) and 6 (orange line). Both cylinders are experiencing severe detonation with combustion in cylinder 5 starting much sooner than in cylinder 6. The ignition timing was the same for both cylinders but the properties of the AFN mixture in the cylinder at the time of combustion were substantially different even though the AFN settings outside the cylinders were equivalent. Peak combustion pressure in cylinder 5 occurs at 6 ATDC while peak combustion pressure for cylinder 6 occurs at 22 ATDC. Although not displayed on this particular graph cylinder 6 is generating significantly less power than cylinder 5.
Nitrous Engine HP/Torque/MEP
vs. Elapsed Time
The horizontal axis indicates elapsed time during the run. The top graph indicates HP for cylinder 5 (yellow line) and rpm (white line - rightside scale). The middle graph indicates torque for cylinder 5 (yellow line) and rpm (white line - right side scale). The bottom graph indicates mean effective pressure for cylinder 5 (yellow line) and rpm (white line - rightside scale).
During this run HP increases from 150 at the start of the run to 250 hp by the 2.5 second mark for cylinder 5. Torque fluctuates with rpm as the the transmission shifts during the run as well as with the sequential addition of the 4 nitrous stages. If more cylinders were instrumented each could be compared simultaneously for the entire run. Knowing the torque and HP generated at various points during the run allows the tuner to optimize the nitrous and engine variables to generate smooth inputs to the drivetrain, minimizing tire shake, spinning, shock loads and of course ETs.
Nitrous Maximum Combustion Pressure
The upper graph indicates the peak combustion pressure (yellow line) for each combustion cycle (cylinder 5) and the white line indicates engine rpm. On this run combustion pressures fluctuate substantially averaging 3000 -3750 psi depending on engine rpm but going as high as 5000 psi and as low as 2300 psi. Excessive pressures such as 5000 psi can cause catastrophic results. Obviously the combustion process was very unstable during this run. The graphical/numerical data which can be viewed for each and every cycle (as outlined at the top of the webpage) would show severe detonation for some cycles and lazy combustion for others.
The lower graph indicates where peak combustion pressure occurred relative to TDC for each combustion cycle. The location of peak combustion pressure fluctuates substantially with rpm and the unstable combustion process. Engine adjustments leading to a more stable combustion process would generate more power with less stress on the engine.

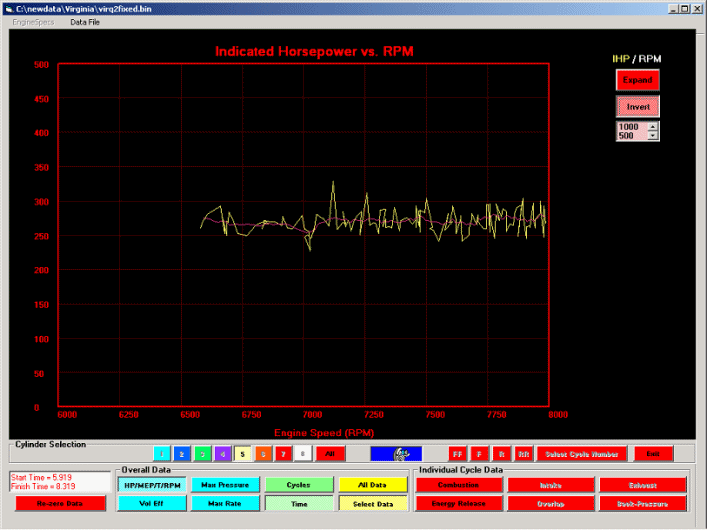
Nitrous Engine HP vs. RPM (Dyno Style)
The graph above displays HP (yellow line) for each combustion cycle in high gear for cylinder 5 and an average HP (pink line) for cylinder 5 as well. HP is plotted vs. rpm indicating that the average HP was almost constant with changing rpm in high gear. The power in cylinder 5 was fluctuating wildly from cycle to cycle. Efforts to stabilize the combustion process at the level of the better combustion cycles would result in significant gains on the track.
Areas for Improvement (Combustion)
- Stabilize the combustion process throughout the entire run
- Equalize the combustion process in each cylinder
- Reduce cycle to cycle variation in the combustion process
- Maximize the number of good combustion cycles
- Further optimize the good combustion cycles to generate more torque
- Extend the rpm range where good combustion can occur.
Return to Top
Last Updated by TFX Jan 27, 2023
Site design © Todd Paton Web Design |