Nitromethane Engine Combustion Data
The following graphs display data collected from a competitive nitro engine during competition at a national event. The engine was naturally aspirated operating on a fuel mixture of approximately 96% nitromethane and 4% methanol.
The data below represents only a small sample of the various data graphs produced after each run down the dragstrip. The software generates graphs summarizing the overall run in terms of HP, torque, combustion pressure, location of peak combustion pressure relative to TDC, volumetric efficiency etc. The software also generates graphs for each and every combustion and non combustion cycle during the run, displaying pressure vs. crank angle, air/fuel burn rates vs. crank angle and numerical data such as HP for each combustion cycle, peak combustion pressure/location, amount of energy released and how efficiently it was applied, etc.

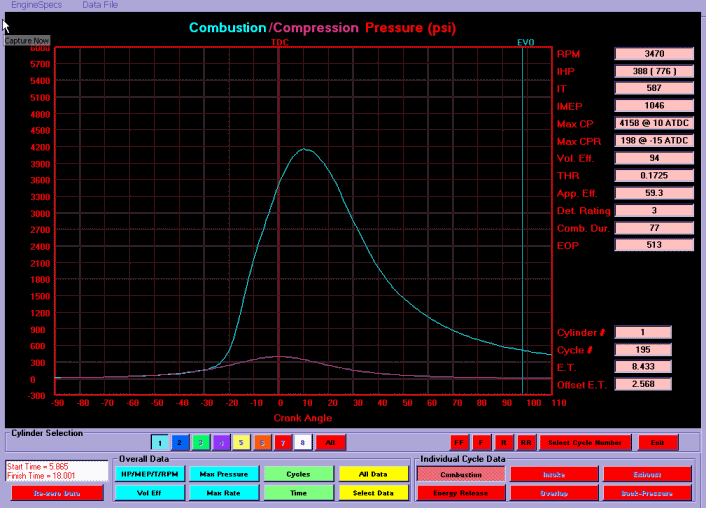
Nitromethane Combustion Pressure
(Combustion Cycle 195 midway through the run)
In the graph above the pink line shows the pressure that would have existed in cylinder 1 if the spark had not ignited the nitro mixture. The blue line shows the actual pressure in cylinder 1 which was developed as a result of the nitro mixture combustion. Peak combustion pressure is 4158 psi at 10 ATDC for this combustion cycle (2.568 seconds into the run). The same engine operated on racing gas would generate a peak combustion pressure of only 1500-1800 psi. During this cycle no detonation was occurring in the cylinder.
Nitromethane Combustion Pressure
(Combustion Cycle 303 late in the run)
The combustion process in cylinder 1 deteriorated significantly late in the run. At the 6.039 second mark peak combustion pressure is only 1461 psi, way down from over 4000 psi at the midway point of the run. Power is also down from 388 hp/cylinder in the first graph, midway through the run (2.568 seconds) to 238 hp/cylinder near the end of the run (6.039 seconds). Clearly significant gains in speed and ET could be made by correcting the combustion cycles near the end of the run.
Nitromethane Engine Torque vs. Time
Engine torque for cylinder 1 is indicated by the blue line and engine rpm by the white line. Engine torque for cylinder 1 (blue line) starts off high at the beginning of the run near 600 ft.lb. then deteriorates throughout the run to a mere 400 ft.lb. as the combustion process is not properly stabilized. A substantial amount of cycle to cycle variation in the combustion process results in the torque for cylinder 1 varying by +/-10 % from cycle to cycle in addition to deterioration of the combustion process with time.
Nitromethane Engine Torque vs. Time
Comparison of 2 Instrumented Cylinders
Engine torque for each instrumented cylinder is indicated by the 2 blue lines and engine rpm is indicated by the white line. In this graph the dark blue line represents a second instrumented cylinder which clearly has even more cycle to cycle variation in torque than the first cylinder. In fact the second cylinder stops firing about 0.75 seconds before the first cylinder indicating that the second instrumented cylinder died before the end of the run. Combustion conditions in the second cylinder were poor throughout the run leading up to the combustion process being extinguished before the finish line.
Nitromethane Combustion Pressure
Comparison of 2 Instrumented Cylinders
The combustion pressure graphs of Cycle 195 (2.568 seconds into the run) are shown for the first instrumented cylinder (light blue line) and the second instrumented cylinder (dark blue line). On this cycle the second cylinder develops substantially more peak pressure and pressure on the power stroke than the first cylinder. This is a good combustion cycle for the second cylinder and on this cycle 667 ft.lb. of torque was developed by this cylinder. Unfortunately the combustion process in the second cylinder was unstable and the number of good combustion cycles during the run were minimal.
Nitromethane Maximum Combustion Pressure vs. Time
The upper graph indicates the peak combustion pressure (blue line) for each combustion cycle (cylinder 1) vs. time and the white line indicates engine rpm vs. time. As previously indicated combustion pressures decreased as the run progressed. Near the beginning of the run peak pressures per cycle were 3500-4000 psi and near the end of the run peak pressures were 1000-1500 psi as the combustion process became unstable.
The lower graph shows the location of peak combustion pressure ATDC for each combustion cycle vs. time. At the start of the run peak combustion pressure was located around 15-20 ATDC, by the end of the run the peak combustion pressure location had shifted by about 5 degrees to 20-25 ATDC with a substantial increase in cycle to cycle variation.
Areas for Improvement (Combustion)
- Stabilize the combustion process throughout the entire run
- Equalize the combustion process in each cylinder
- Reduce cycle to cycle variation in the combustion process
- Maximize the number of good combustion cycles
- Further optimize the good combustion cycles to generate more torque
- Extend the rpm range where good combustion can occur.
Return to Top
Last Updated by TFX Jan 27, 2023
Site design © Todd Paton Web Design |